
Why fluorescence spectrophotometry offers lower detection limits than UV-Vis spectrophotometry
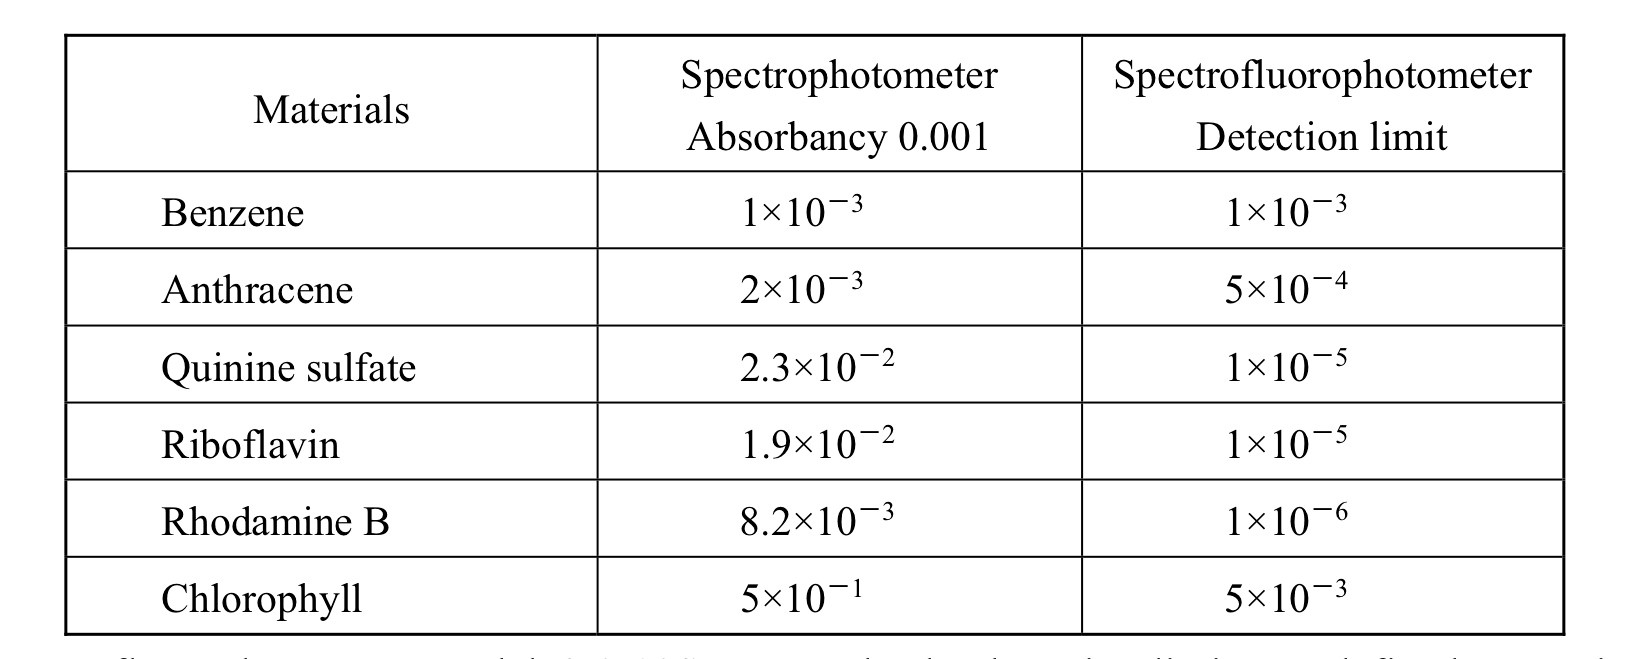
Many people are surprised to discover that fluorescence spectrophotometry can offer detection levels up to three orders of magnitude lower than UV-Vis spectrophotometry even though fluorescence intensity emissions are much weaker than the signals in a UV-Vis spectrophotometer. The key to this sensitivity difference is that the fluorescence signal is measured directly with no contribution to the signal from the source beam, whereas measurements in a UV-Vis spectrophotometer are based on the difference between the transmission signal and the original incident beam. This results in significant differences in the noise contributions to the measured signal in each technique.
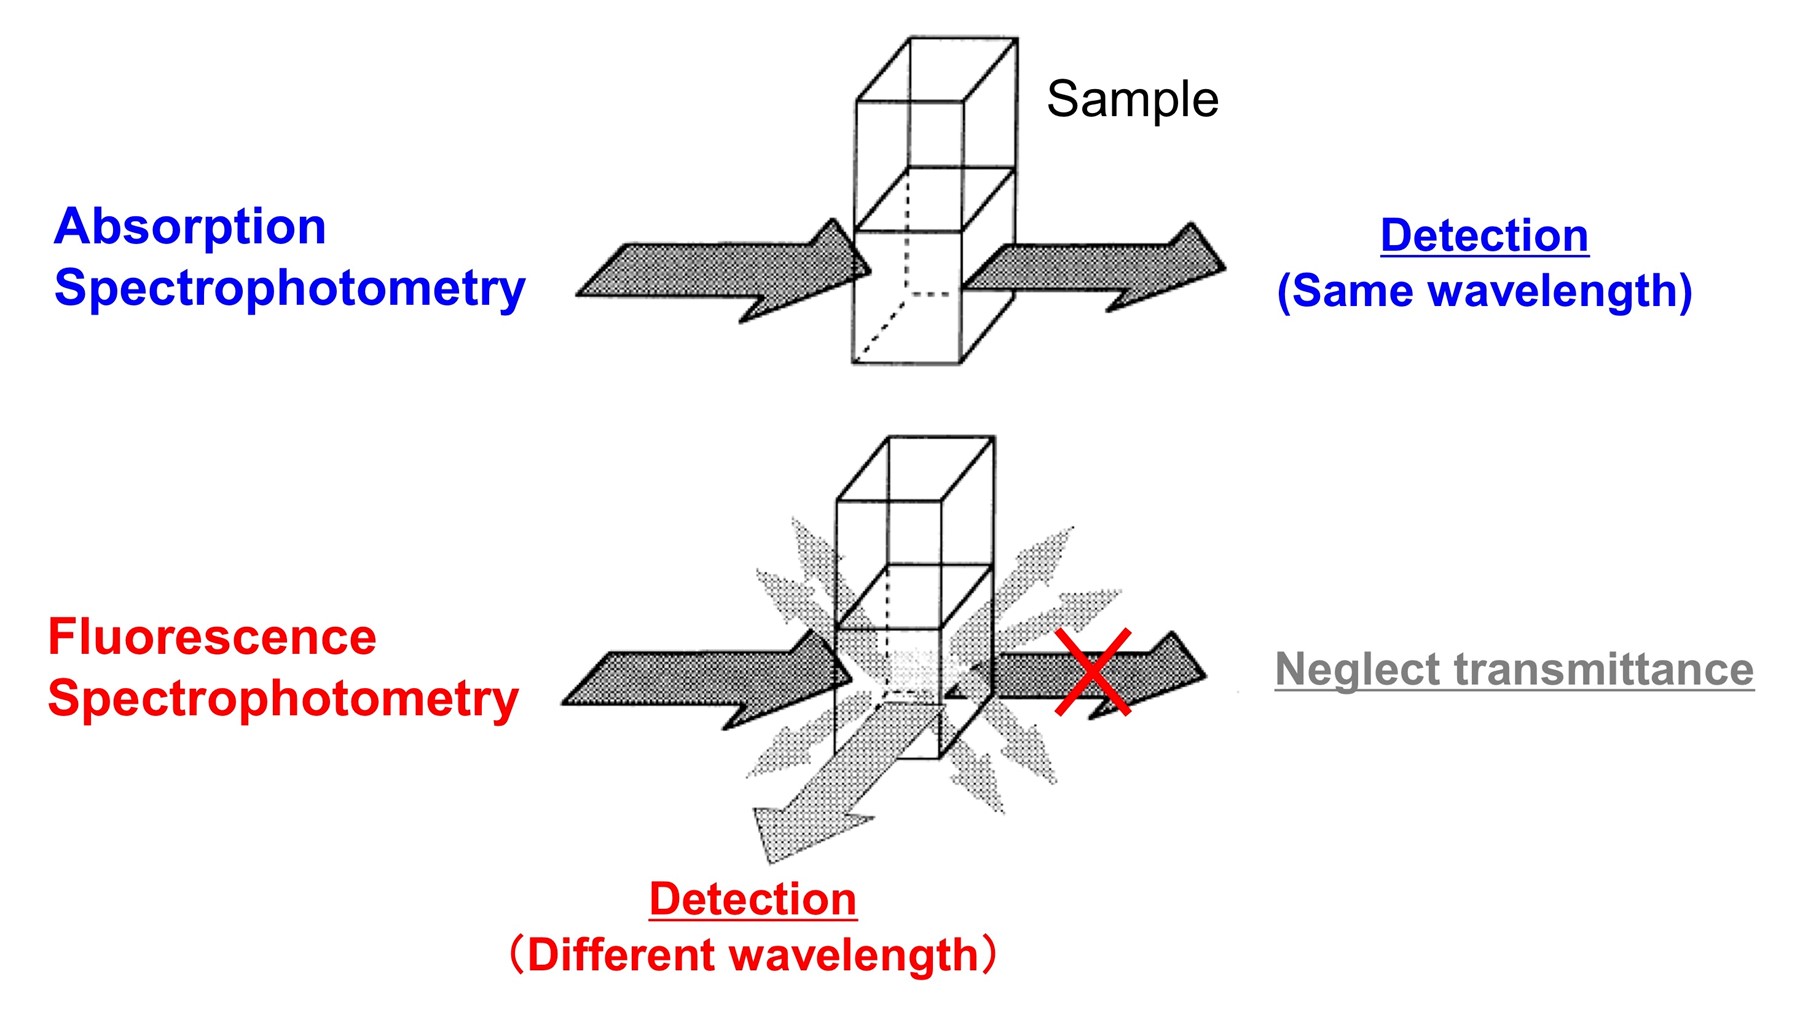
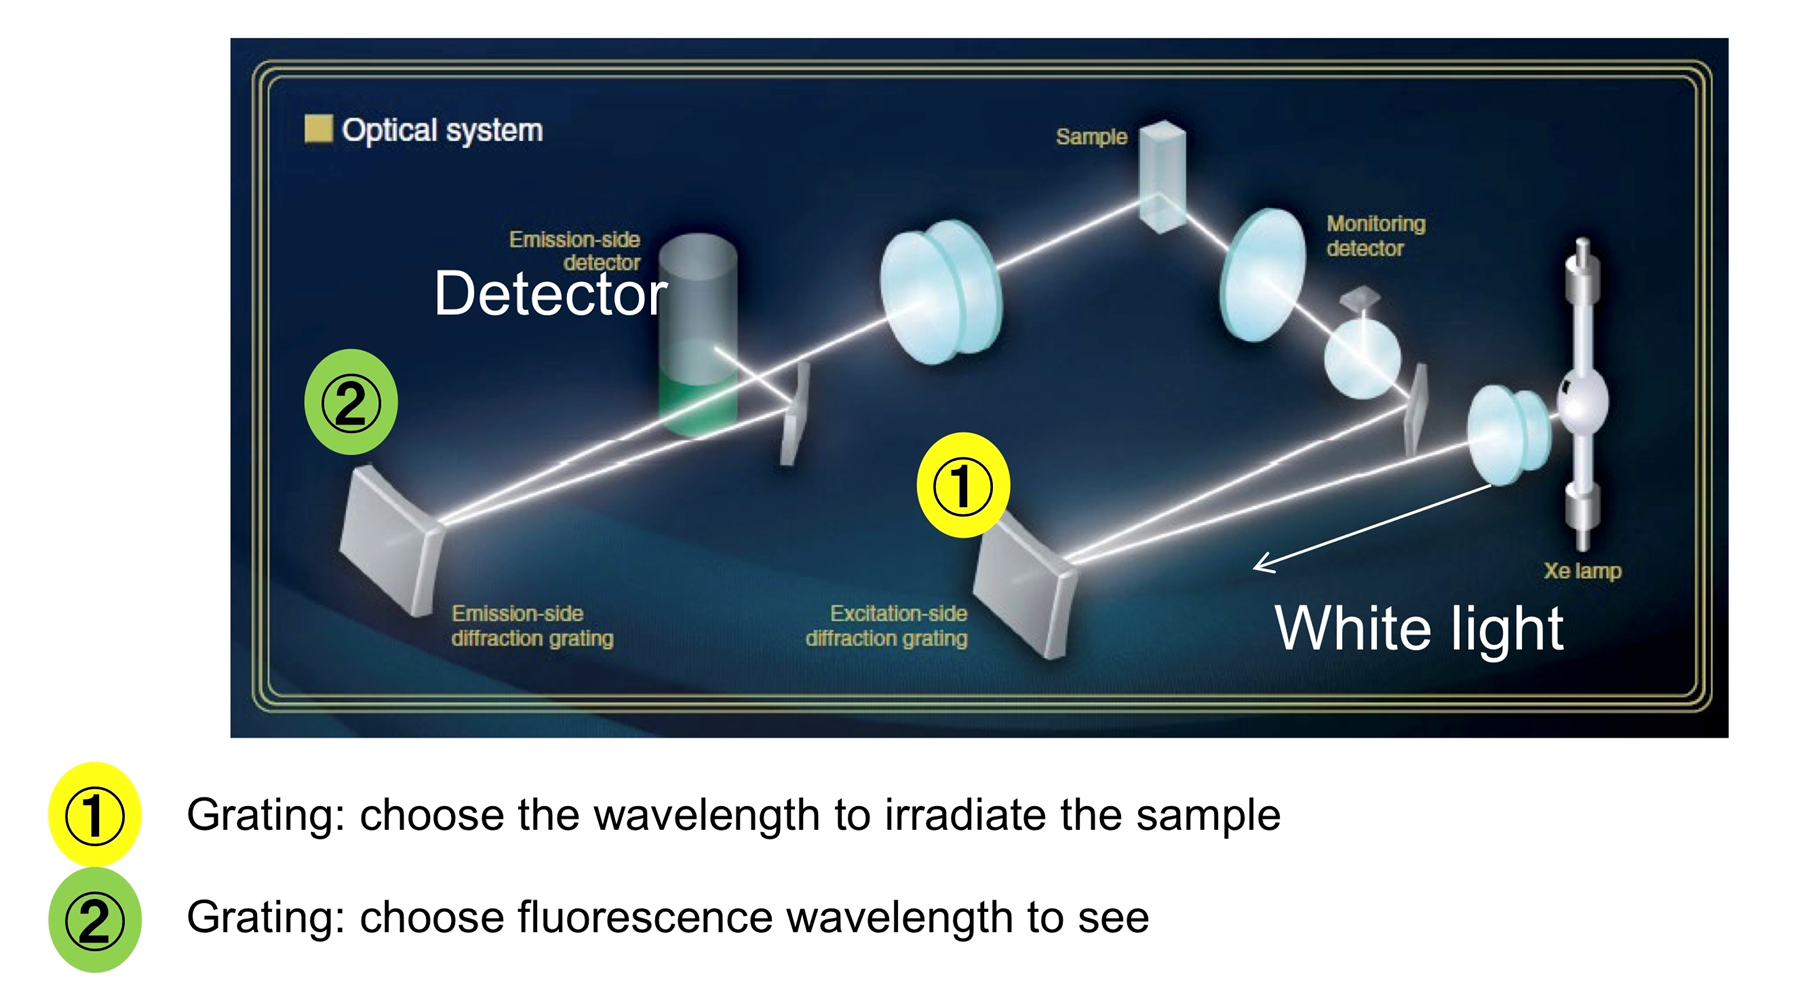
Principles of fluorescence and its measurement
In absorption spectrophotometry light is detected at the same wavelength as the incident beam, while in fluorescence spectrophotometry, light is collected at longer wavelengths than the incident beam. In fluorescence, irradiated UV or Visible light excites the electrons in molecules of certain compounds and causes them to emit light (fluorescence). The fluorescence always has a lower energy (and therefore longer wavelength)'than the original illumination and is emitted in all directions. In UV-Vis absorption spectroscopy, the light transmitted directly through the sample is measured, while in fluorescence spectrophotometry, the fluorescence detector is positioned to collect the fluorescence light emitted perpendicular to the incident light beam with no contribution from the transmitted light.
Fluorescent materials have applications in a host of industries, and by using fluorescence markers to tag specific molecules, fluorescence spectrophotometry is also widely used in biochemistry, clinical chemistry, pharmaceutical research and quality control, and environmental analysis.
Noise, sensitivity and detection limits
The sensitivity of a spectrophotometer is determined by the signal-to-noise ratio (S/N). According to the Beer-Lambert law, absorbance is a linear function of the concentration of the sample, but the UV-Vis spectrophotometers actually measure the light transmitted through the sample and compare it to the light transmitted through a blank sample (zero concentration). The difference between these two measurements allows the absorbance to be calculated.
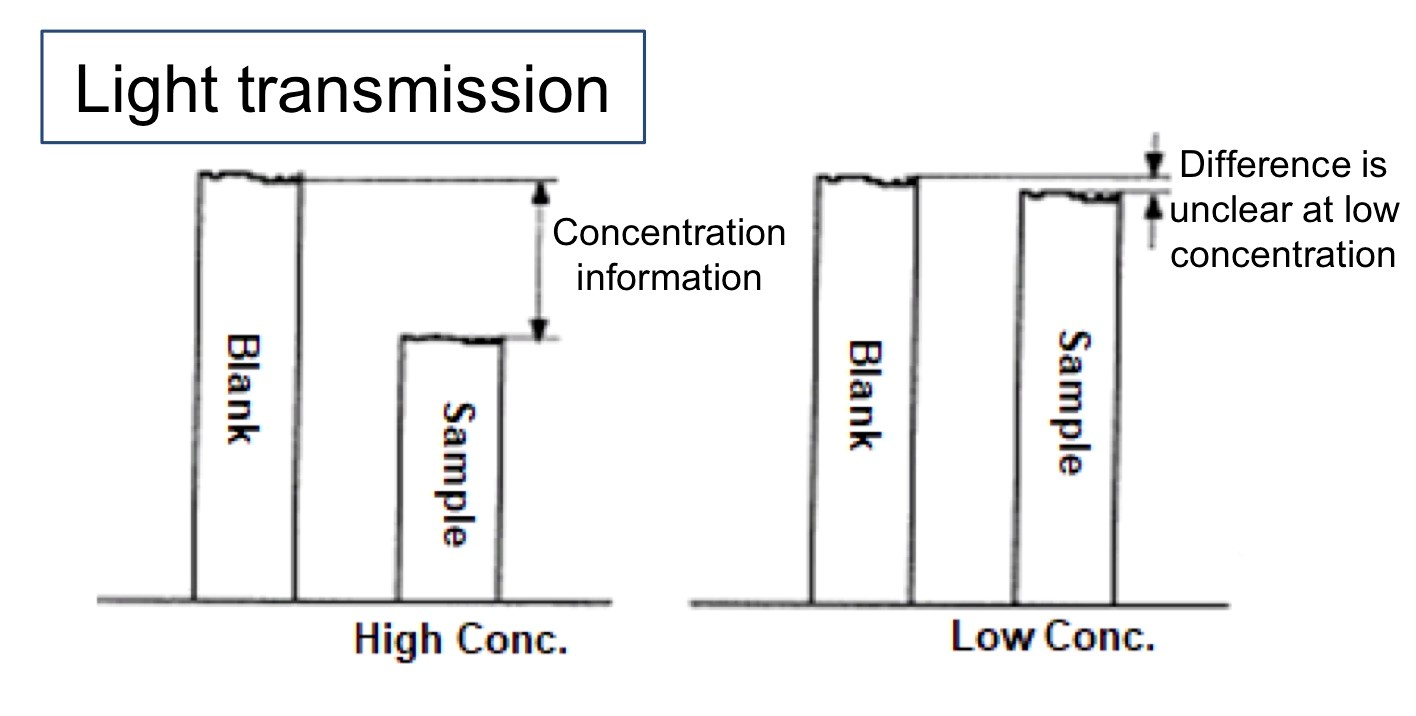
As can be seen above, for high concentration samples a lot of light is absorbed by the sample so there is a significant difference between the two measurements. However at low concentrations, very little of the light is absorbed, so the measurement is based on the small difference between two very large signals. Noise within the detection system will affect both the blank and sample signals and will be additive in the difference signal. As the measured difference becomes smaller at lower sample concentrations, the noise becomes an increasingly large proportion of this difference measurement. This increase in noise reduces the S/N, limiting the sensitivity and the ultimate detection limits.
In fluorescence spectrophotometry, the fluorescence signal is measured directly and not subtracted from a blank measurement.
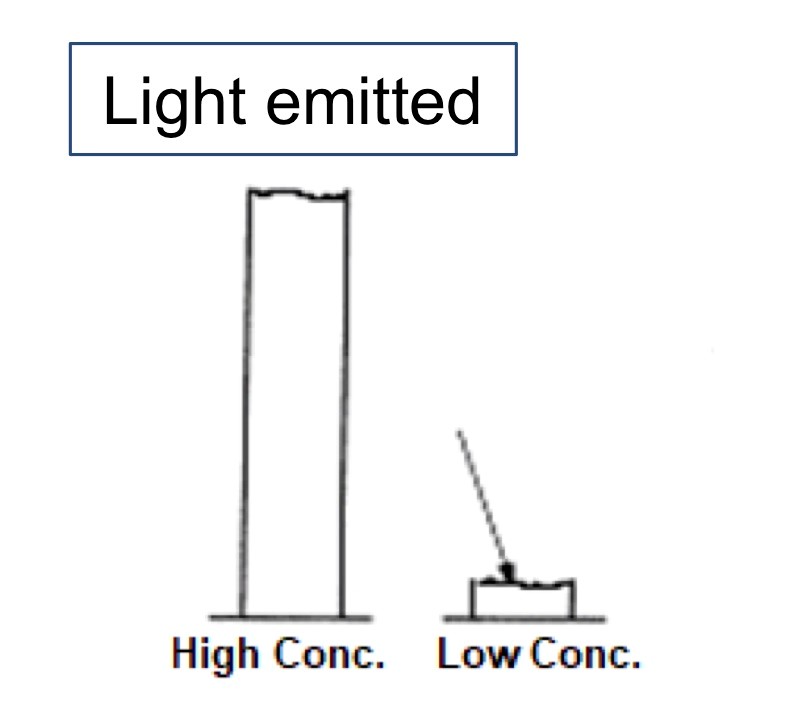
Since there is no subtraction from a reference signal, the contribution from noise is smaller than for the UV-Vis absorption spectrophotometer leading to better sensitivity and detection limits.
Be careful of fluorescence sensitivity claims
Although sensitivity is measured as the signal-to-noise ratio on a particular peak, there is no internationally agreed standard for sensitivity measurement in fluorescence spectrophotometers. It is possible to quote different signal-to-noise values on a particular peak simply by taking the noise measurements at different positions. While instrumental conditions can be optimized for good signal-to-noise and apparently high sensitivity, those same operating conditions may be totally unsuitable for real world analysis. This makes it difficult to compare one instrument against another on the basis of the numerical sensitivity figures alone. These factors are discussed in another blog: 'Measuring sensitivity in fluorescence spectrophotometers'. The best method of evaluating performance of different instruments is to compare the results obtained on real samples under the operating conditions required for those samples.
Additional information from a fluorescence spectrophotometer
The configuration of a fluorescence spectrophotometer allows two types of spectra to be acquired. The fluorescence intensity can be monitored as a function of excitation wavelength (excitation spectrum) or the fluorescence output at different wavelengths can be measured at a fixed excitation wavelength (emission spectrum).
In UV-Vis spectrophotometry there is only an absorption spectrum. The excitation spectrum can used to determine the most effective excitation wavelength to induce fluorescence and produces a spectrum very similar to the absorption spectrum of absorptiometry. In many cases, samples with similar excitation spectra will have differing emission spectra and so can be differentiated using fluorescence spectrophotometry when it would not be possible using UV-Vis spectrophotometry.
Another powerful measurement technique is fluorescence 'fingerprinting, using 3 dimensional scanning in the Excitation Emission Matrix (EEM) method. The intensity of the fluorescent light emitted during a 3D scan is dependent on both the excitation and emission wavelengths. A fluorescence fingerprint is obtained by plotting these 3 parameters in three dimensions as an aerial view or contour map. In the contour map, the contour lines represent regions of the same fluorescence intensity and the characteristic maps allow individual components to be identified. There is more detail on this exciting technique in our blog entitled: 'Fluorescence fingerprinting using the Excitation Emission Matrix (EEM)'.
Fluorescence spectrophotometers from Lambda Advanced Technology
Lambda Advanced Technology is a leading supplier of analytical instruments for a wide range of applications, including some of the best-in-class fluorescence spectrophotometers. If you would like more information, simply contact a member of the team today.