
Measuring sensitivity in a fluorescence spectrophotometer
The sensitivity of a spectrophotometer is determined by the signal-to-noise ratio (S/N), so good sensitivity requires high signal levels and low noise levels. Surprisingly there is no internationally recognised standard for measuring sensitivity in a fluorescence spectrophotometer. This makes it difficult to compare one instrument against another on the basis of the numerical figures alone. The ideal sensitivity test sample would be very stable with weak fluorescence and should be readily available. In the absence of such a sample, however, the most frequently used peak is the Stokes-Raman peak of water. While it is possible to choose instrumental operating conditions which will maximise the measurement of the signal and minimise the measurement of noise to give a high "sensitivity" value, using the instrument with these settings could seriously compromise other areas of performance such as resolution, analytical accuracy or instrument response. Instrumental settings such as the choice of excitation and emission wavelengths, the slit widths on the excitation and emission monochromators, the response time of the photomultiplier detection system, and even the way and position at which the noise is measured all influence the measured S/N.
Where and how to measure noise
The measurement of noise is of major importance in calculating S/N. Ideally, noise should be measured at the same wavelength and under the same operating conditions, i.e. at the top of the Raman peak. Frequently, however, the noise is measured at a different wavelength in a part of the spectrum where noise is less. The diagram shows comparisons of the noise over time (in seconds) recorded on top of the peak at 398 nm (top trace) and away from the peak at 450 nm (bottom trace).
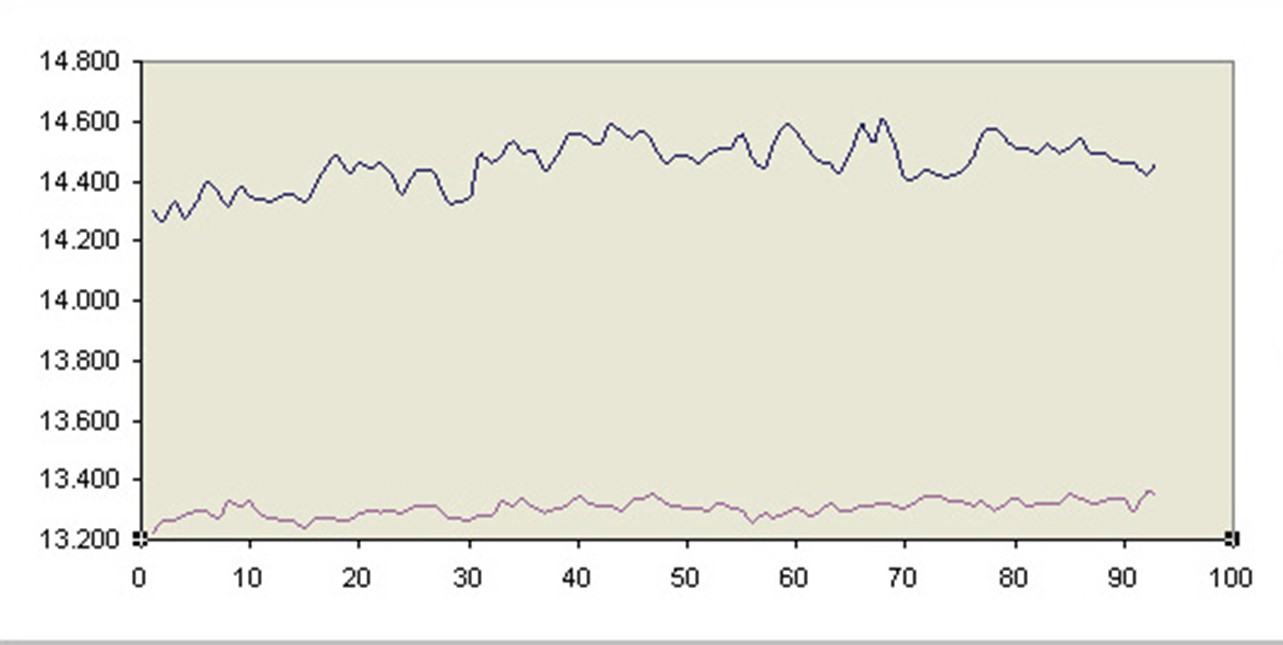
Measuring at the top of the peak gives greater noise, leading to a poorer figure for sensitivity. In addition, the value for noise levels can be calculated in a variety of ways including peak-to-peak and root mean square (RMS). RMS has a smoothing effect on the peak-to-peak values, giving apparently lower noise measurements. Amazingly, a variation in sensitivity figures of more than 4:1 can be obtained from a single data set from a single spectrum, simply by varying the position and method of measuring noise:
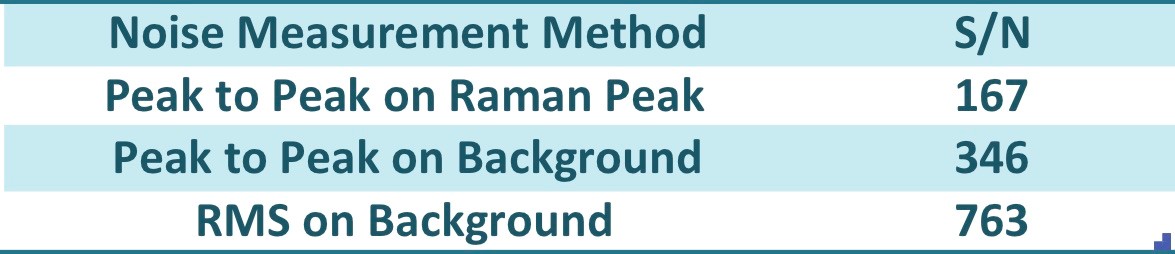
However it is the peak-to peak noise which has biggest effect in low signal level measurements, so sensitivity figures made using peak-to-peak noise will give a better indication of the true capabilities of the instrument.
The effects of slit width and detector response on S/N
The optical configuration of a fluorescence spectrophotometer includes independent monochromators for excitation and emission wavelength measurement.
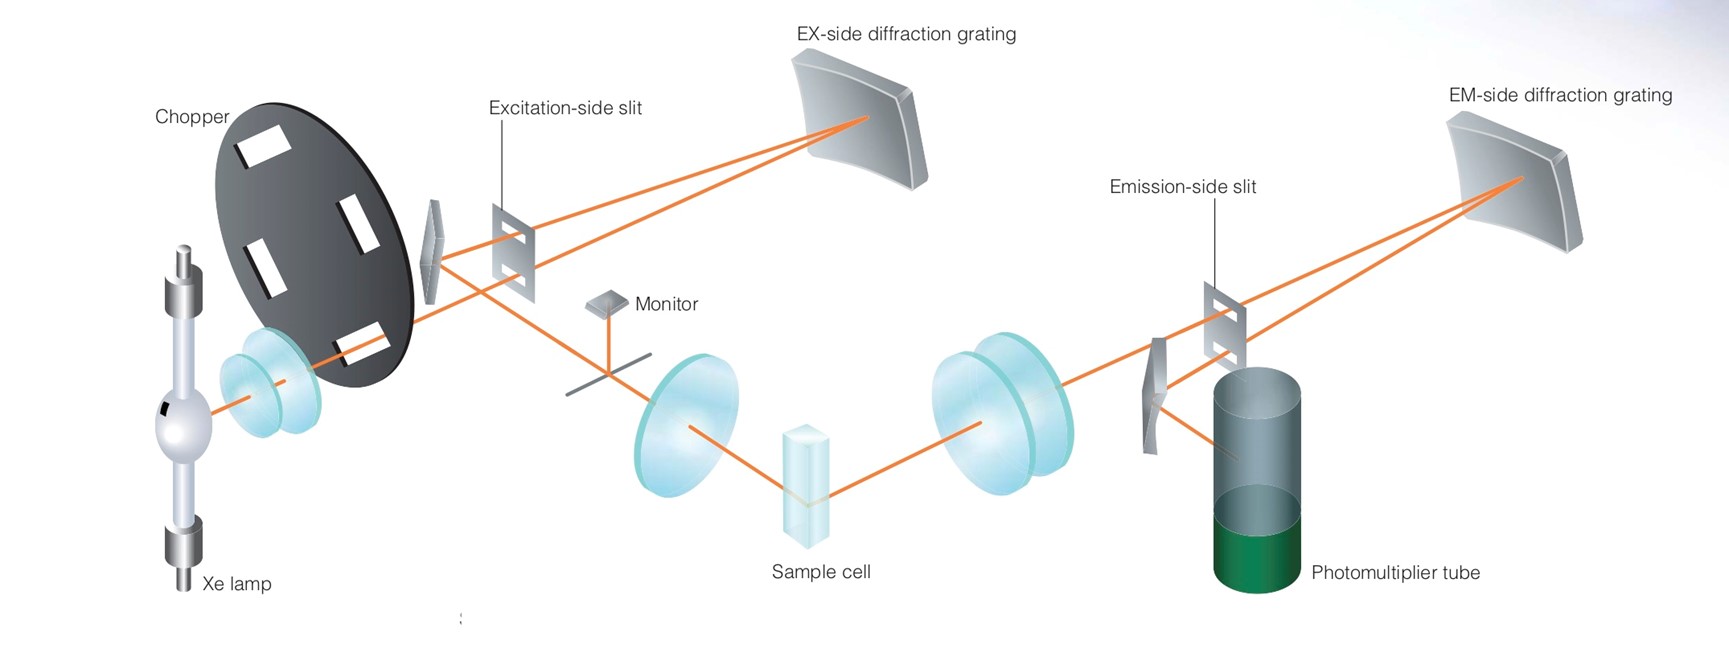
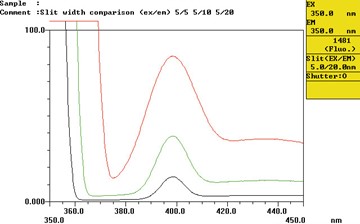
This means that the entrance slits for the two monochromators can be adjusted independently. Increasing the slit widths increases the amount of light reaching the sample and detector thus increasing the signal level, and slowing down the response of the detector will smooth out noise. Unfortunately, although signal levels go up with increased slit widths, this is accompanied by significant degradation of the instrumental resolution:
In addition, using a long detector response time increases the time needed to make individual measurements. This not only reduces sample throughput rates but also makes it impossible to make kinetic measurements which require the monitoring of rapid signal changes.
Making sense of the numbers
Enormous differences in sensitivity figures that can be obtained by varying experimental conditions and measurement methods, so it is important to make sure that sensitivity figures for individual instruments are compared under the same operating conditions. The table shows how the numbers can vary widely for 4 different instruments.
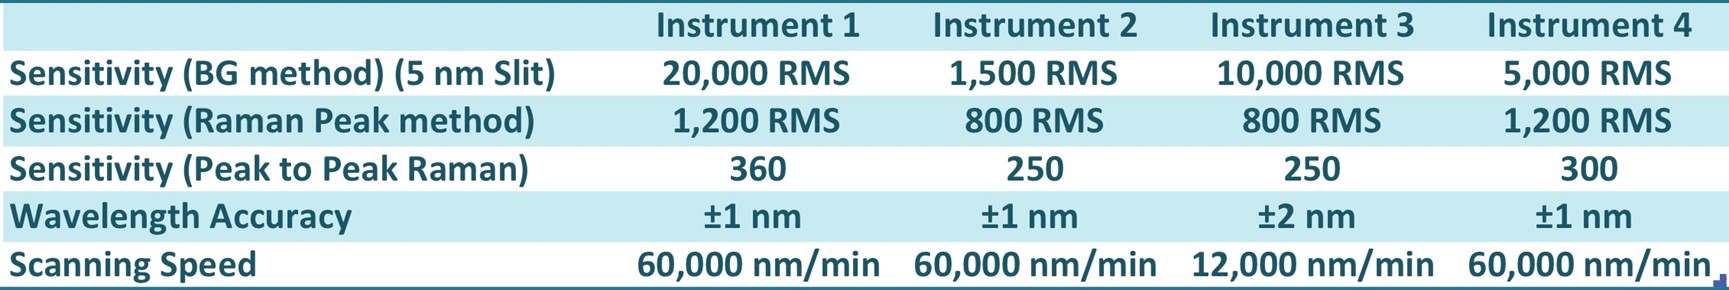
Although the numerical figures are lower, the most reliable measure of sensitivity comes from peak-to-peak measurements at the top of the Raman peak of water.
Fluorescence spectrophotometers from Lambda Advanced Technology
Lambda Advanced Technology is a leading supplier of analytical instruments for a wide range of applications, including some of the best-in-class fluorescence spectrophotometers. If you would like more information, simply contact a member of the team today.